A Brief Review of the Trump Economy and His Deal with China
Joseph Sullivan (top graph) and FactSet (bottom graph)
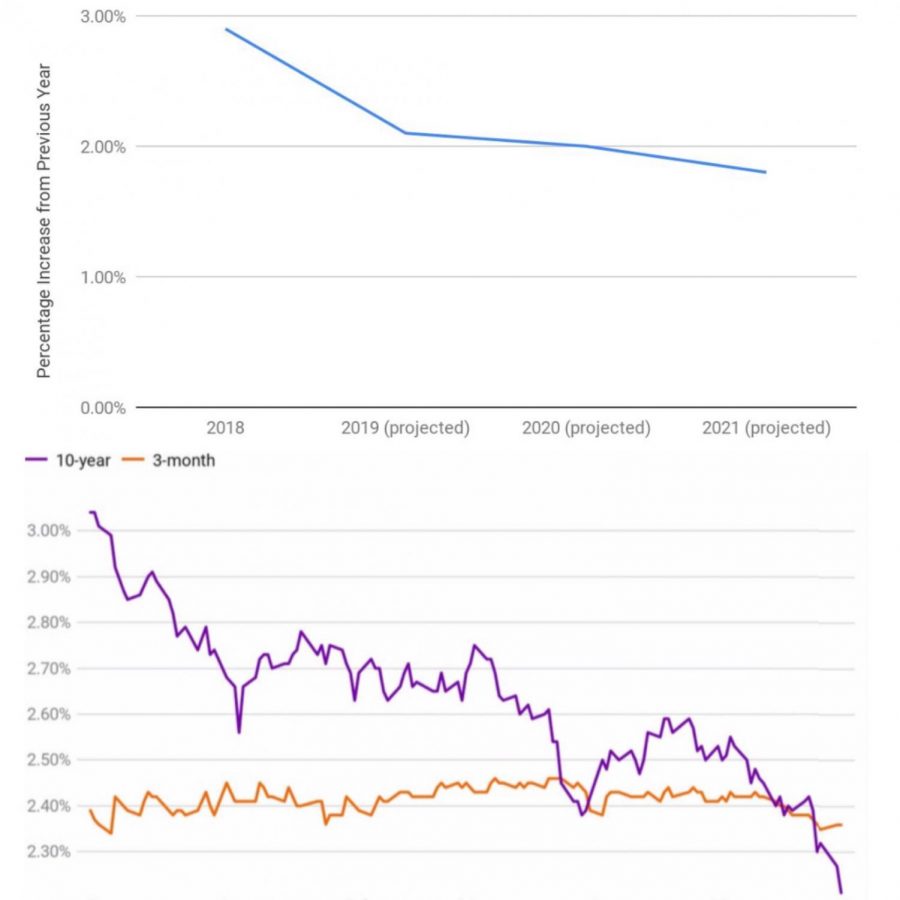
The above graphs predict current and projected growth of the U.S. GDP by 2021 (top graph) and display the yield curve inversions between 10-year and 3-month investments over the past six months (bottom graph).
October 16, 2019
U.S.-China Trade Deal
Last week, Trump told reporters in the Oval Office that a deal with China is being developed for possible completion sometime in November. He outlined aspects of the deal, saying that China will be required to import between $40 to $50 billion worth of U.S. Agricultural Products. Other aspects of the deal included the U.S. Financial Sector having access to Chinese markets.
On the U.S. end of the deal, tariffs that had been planned to rise from 25% to 30% on $250 billion worth of Chinese imports will no longer rise on October 15th. However, the fate of the 15% tariff hike that is planned for December 15th on another $160 billion of imports has not been decided.
“This is something that is going to be great for China and great for the U.S.A.” – Donald Trump
Current Economic Climate
Last month, the unemployment rate fell to 3.5%, reaching a 50 year low and providing the impetus for the storm of positive coverage of the economy that followed. While the unemployment rate is among the most fundamental indicators of economic strength, it would be foolish to limit the public’s view of the economy to only this when so many other indicators are suggesting a more uncertain outlook. The U.S. GDP, for example, suggests that the economy will continue to grow but at a much slower rate. According to data provided by the Federal Reserve, the U.S. GDP growth rate is projected to decline gradually: increasing 2.1% in 2019, 2.0% in 2020, and 1.8% in 2021. Note how the final 2021 projection falls below the ideal growth range of between 2-3%. These downtrending projections are especially problematic in light of the 2.9% growth peak that the U.S. GDP exhibited last year (2018).
It is instantly apparent that the U.S. economy is slowing, yet this is not a surprise when compared to the sluggish global economy. Germany, which claims the spot as Europe’s largest economy, is forecasted to fall into a recession once their quarter 3 GDP, which is believed to have declined, is released. This illustrates the volatile and unstable state of the collective European economy.
Fed Lowers Interest Rates to Combat Global Economic Concern
Concerns related to the problematic global economy and trade-war tensions gave the Fed ammunition for lowering the rates — twice. The rates were lowered to 2.25% in late July and again to 2% in September. This was the first time since the financial crisis that rates have been lowered, and they are likely going to cut them again in late October. In light of the strong employment and inflation rates, these decisions were met by dispute from many economists.
What is the Fed Funds Rate and Why Was Lowering It Controversial?
The Federal Reserve is responsible for adjusting the Federal Funds Rate, which is the interest rate that banks use to borrow money from each other. The concept behind the Fed Funds Rate is that by lowering it during times of economic hardship, banks will be able to more feasibly borrow money from each other, effectively working as an economic stimulus. However, by lowering it during times of economic prosperity, there will be less leeway for lowering rates during hardship. This would make it harder for the U.S. to get out of a recession when one does occur. This describes the controversy behind the recent decreases in the Fed Funds Rate.
The Yield Curve Has Inverted
As addressed earlier, the short-term outlook of the economy is uncertain, and the recent yield curve inversion on treasury notes is a testament to this.
What is a Yield Curve Inversion?
When the economy is in a normal and healthy state, investors can expect to receive a higher yield on longer-term investments, such as 10-year treasury bonds. This is because they are taking a greater risk by investing over a longer period of time than compared to investing in short-term bonds, such as 3-month notes. However, when short-term economic prosperity is at question, the majority of investors will invest in the long-term. This increase in demand drives down the yield of long-term bonds, which may cause short-term bonds to offer relatively higher yields. This constitutes a yield curve inversion.
When did it invert and what does this indicate?
For this reason, yield curve inversions often precede recessions and are viewed as predictors of such. Towards the end of 2018, the yields on the 3-year and 5-year notes inverted, and so far throughout 2019, more intense inversions have occurred — notably, between 3-month and 10-year notes. This suggests a pessimistic short-term outlook on the economy, and the upcoming quarters are expected to be very interesting as new economic developments unfold in response to the trade war.


